Financial Market Data Lakehouse
Building a Reusable Data Engineering Foundation for Financial Market Analysis

Context
I wanted to explore how modern data engineering practices could transform readily available financial market data into a reliable foundation for analysis. Market data is easy to retrieve, but creating a reusable analytical dataset requires deliberate decisions around ingestion, storage, data quality, transformation and feature engineering.
How can raw financial market data be transformed into a reliable, reusable foundation for downstream analysis?
Raw financial market data is relatively easy to obtain, but turning it into a reliable analytical foundation requires ingestion, schema standardization, data quality controls, transformation, feature engineering and reproducible storage. The challenge is to create a pipeline that separates raw data acquisition from progressively refined analytical layers while allowing the resulting datasets to support multiple downstream use cases.
Approach
This project implemented an end-to-end financial market data lakehouse using Python and PySpark. Market data moves through Bronze, Silver and Gold layers, with each stage adding structure, validation and analytical features. The architecture separates data engineering from downstream analysis so the Gold layer can serve as a reusable foundation for multiple analytical datasets.
Data Sources
Yahoo Finance Market Data
Historical daily market data was collected using the yfinance library for selected publicly traded securities. The source data includes OHLC prices, adjusted closing prices, trading volume and ingestion metadata. The current demonstration uses AAPL, JPM and XOM over a rolling ten-year period.
Solution
Implemented a Python-based ingestion layer using yfinance to retrieve historical market data for multiple securities.
Persisted source data as partitioned Parquet files in a Bronze layer organized by ticker, year and month.
Built a PySpark Silver layer that standardizes data types, removes duplicate records and applies data quality checks for prices, volume and high/low relationships.
Created a reusable Gold feature layer using PySpark window functions to calculate returns, price changes, moving averages, price-to-moving-average ratios, rolling volatility, average volume and momentum.
Added a next-day price movement classification target to the Gold layer to demonstrate how engineered features can support downstream analytical use cases.
Built separate time-series and classification datasets from Gold without duplicating upstream transformation logic.
Organized the implementation into modular Python components for ingestion, Bronze, Silver, Gold, dataset construction, configuration and pipeline orchestration.
Added a reproducible Jupyter notebook to run the pipeline, validate the resulting layers and demonstrate the downstream datasets.
Architecture
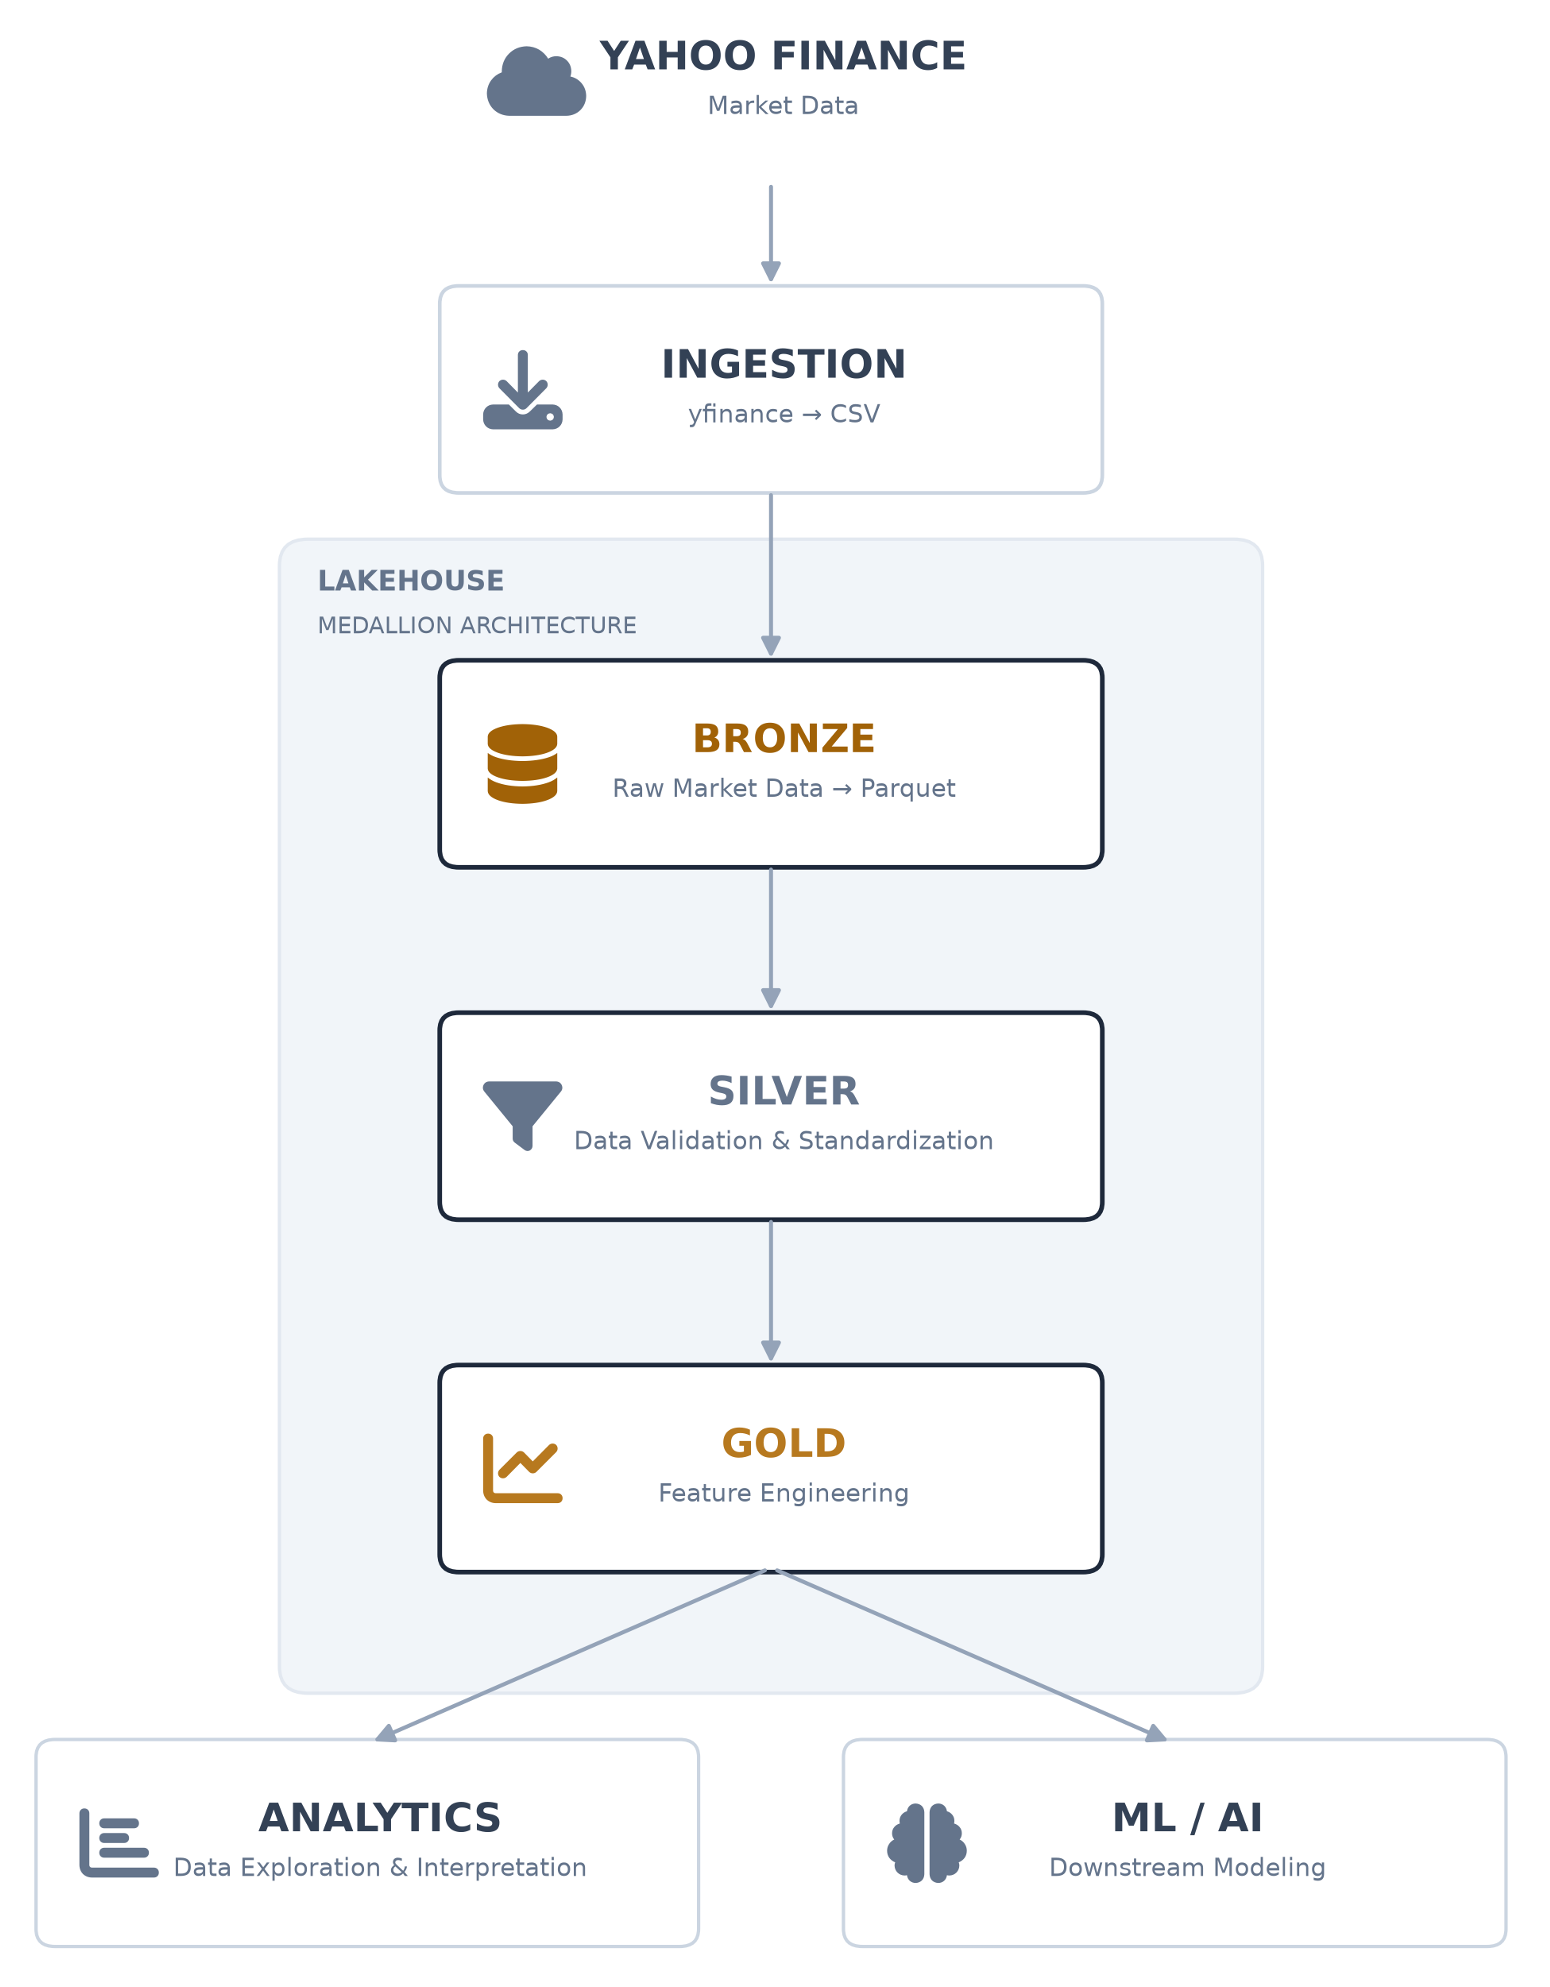
The pipeline follows a Medallion Architecture that progressively transforms externally sourced market data into reusable analytical datasets. Data is acquired through a dedicated ingestion layer, persisted as partitioned Bronze data, standardized and validated in Silver and transformed into a comprehensive Gold feature layer. Purpose-specific time-series and classification datasets are then derived from Gold without duplicating the underlying feature engineering logic.
- 01Market data ingestion
- 02Bronze raw data layer
- 03Silver cleansing and validation layer
- 04Gold analytical feature layer
- 05Downstream time-series and classification datasets
Outcome
The project demonstrated how a Medallion Architecture can transform raw financial market data into a reusable analytical foundation. The current demonstration processes 7,542 market records across three securities and produces persisted Bronze, Silver, Gold, time-series and classification layers. By separating pipeline implementation from downstream analysis, the project provides a structured foundation that can support multiple analytical and machine learning use cases without rebuilding the upstream data workflow.
Data Quality and Layer Validation
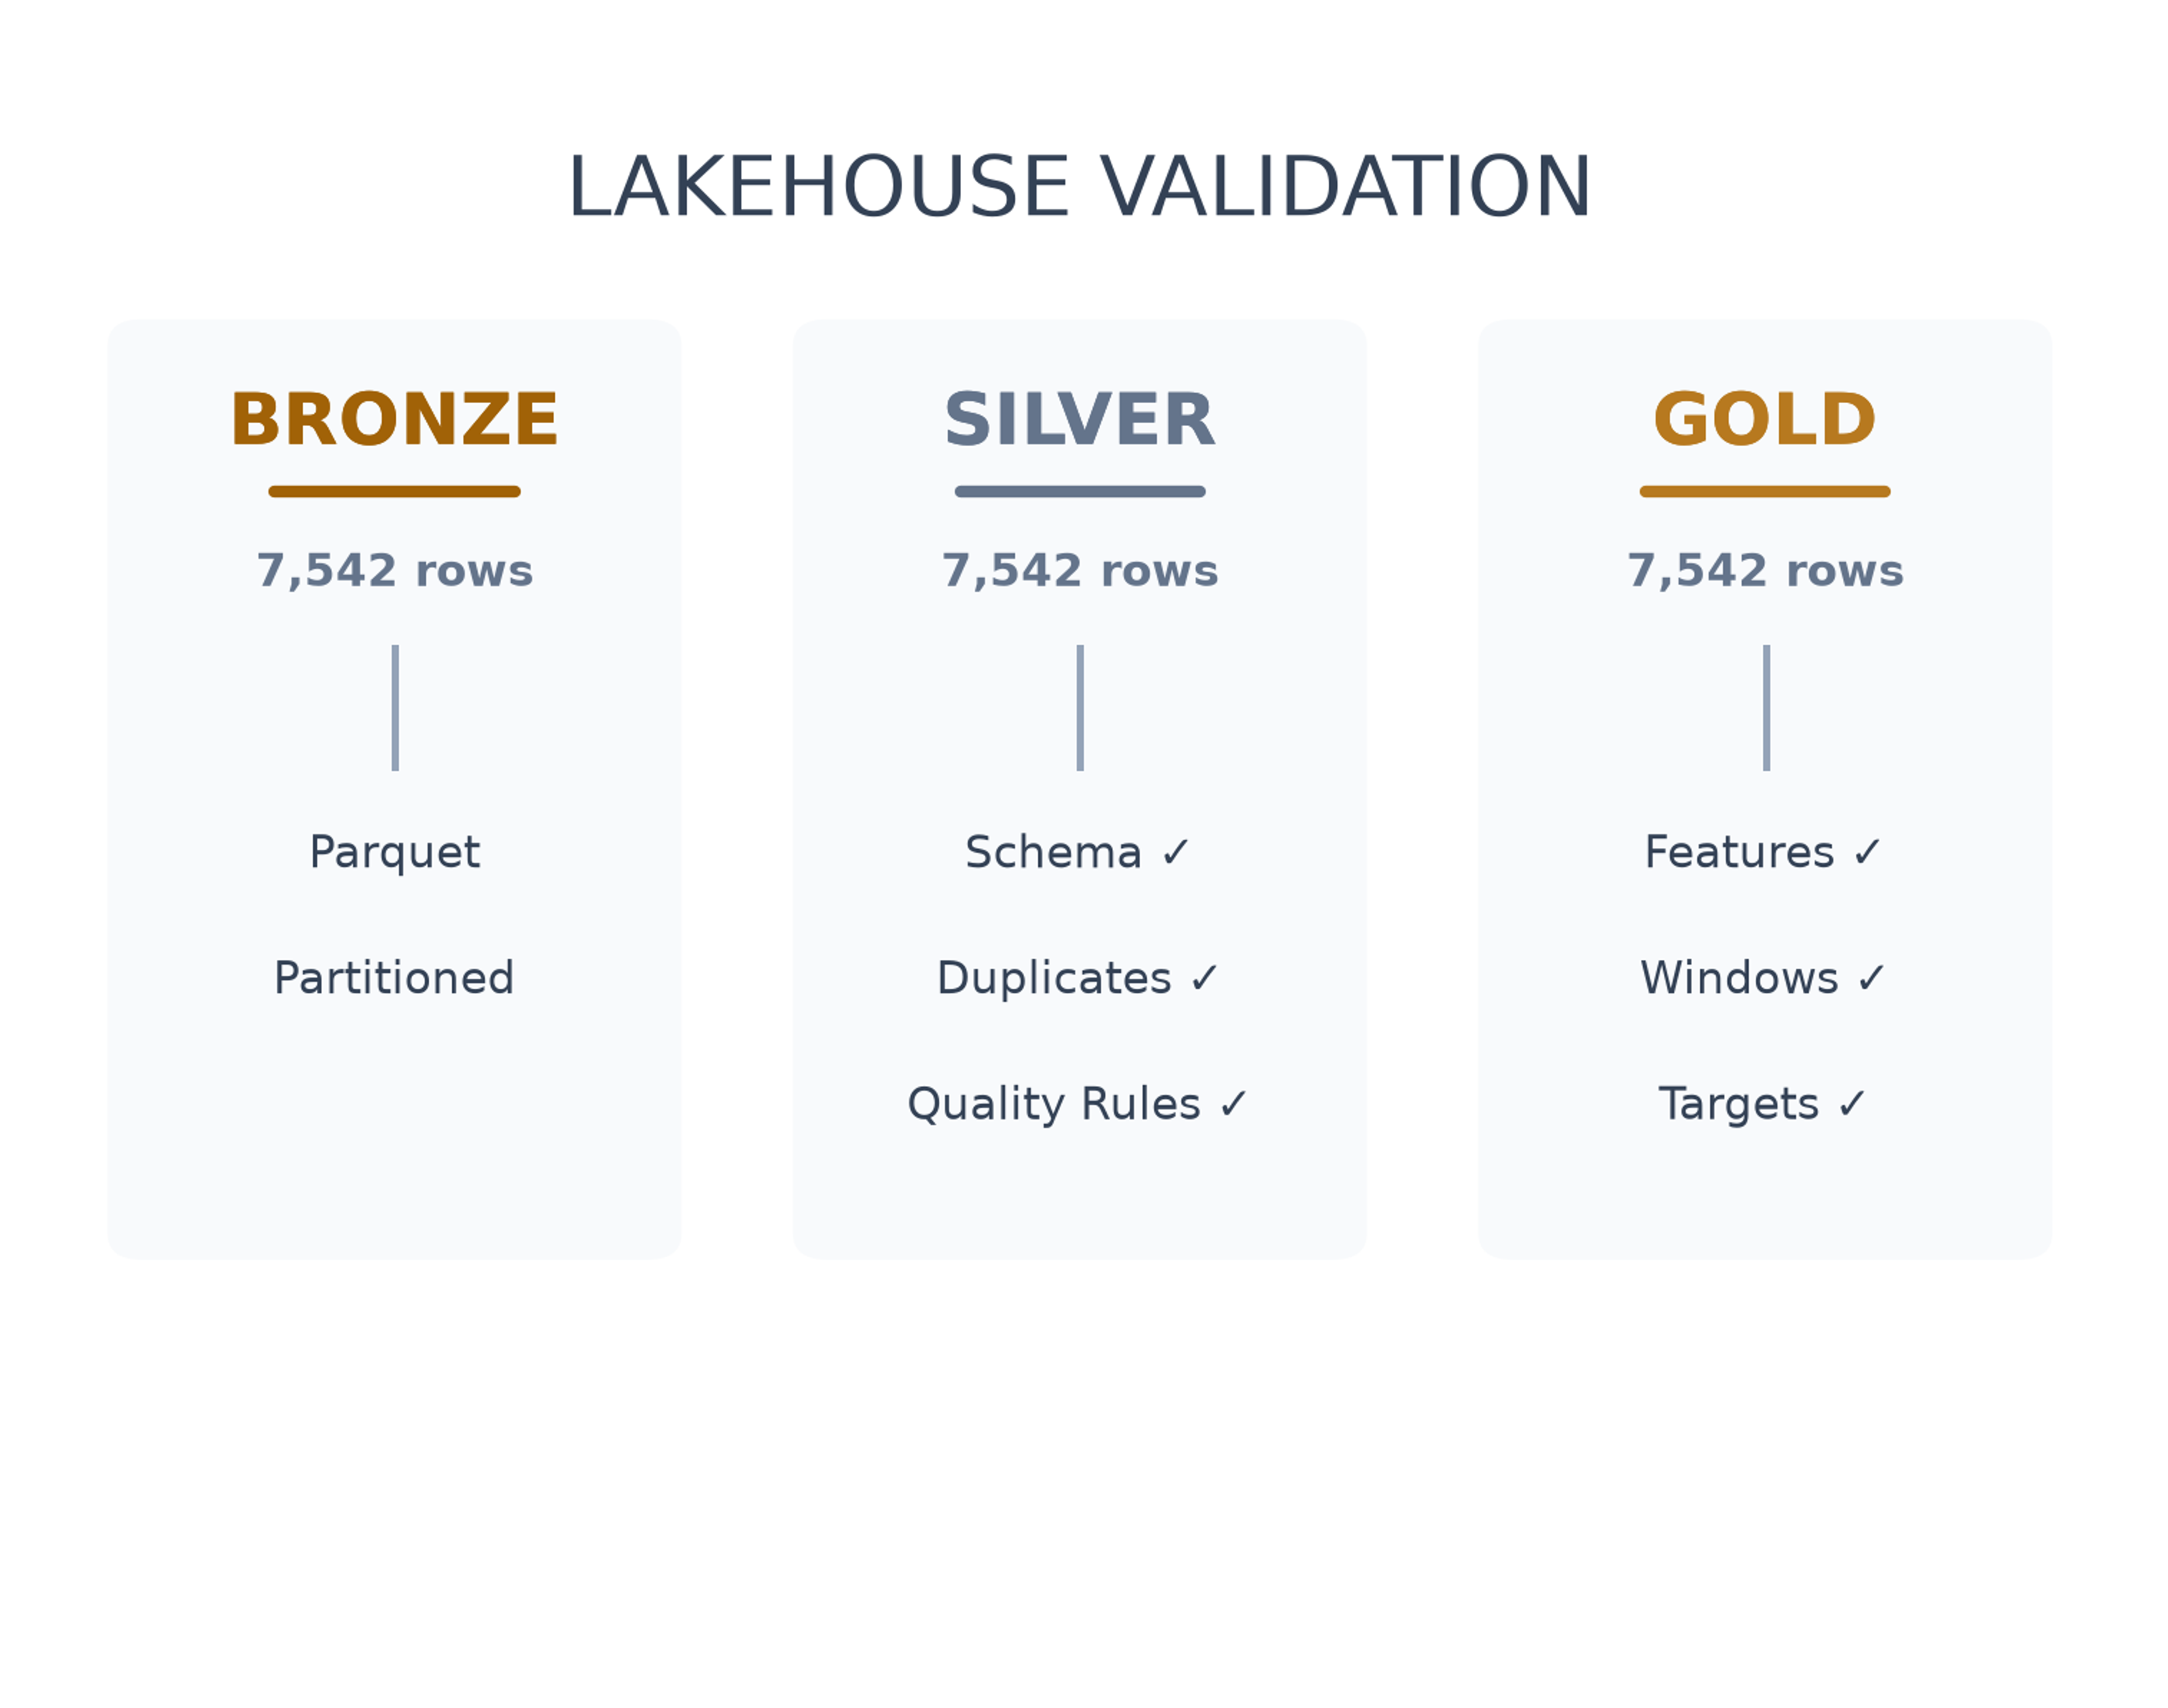
Validation across the Bronze, Silver and Gold layers, showing consistent record counts alongside checks for partitioning, schema consistency, duplicates, data quality, feature generation and target preparation.
Silver Market Data
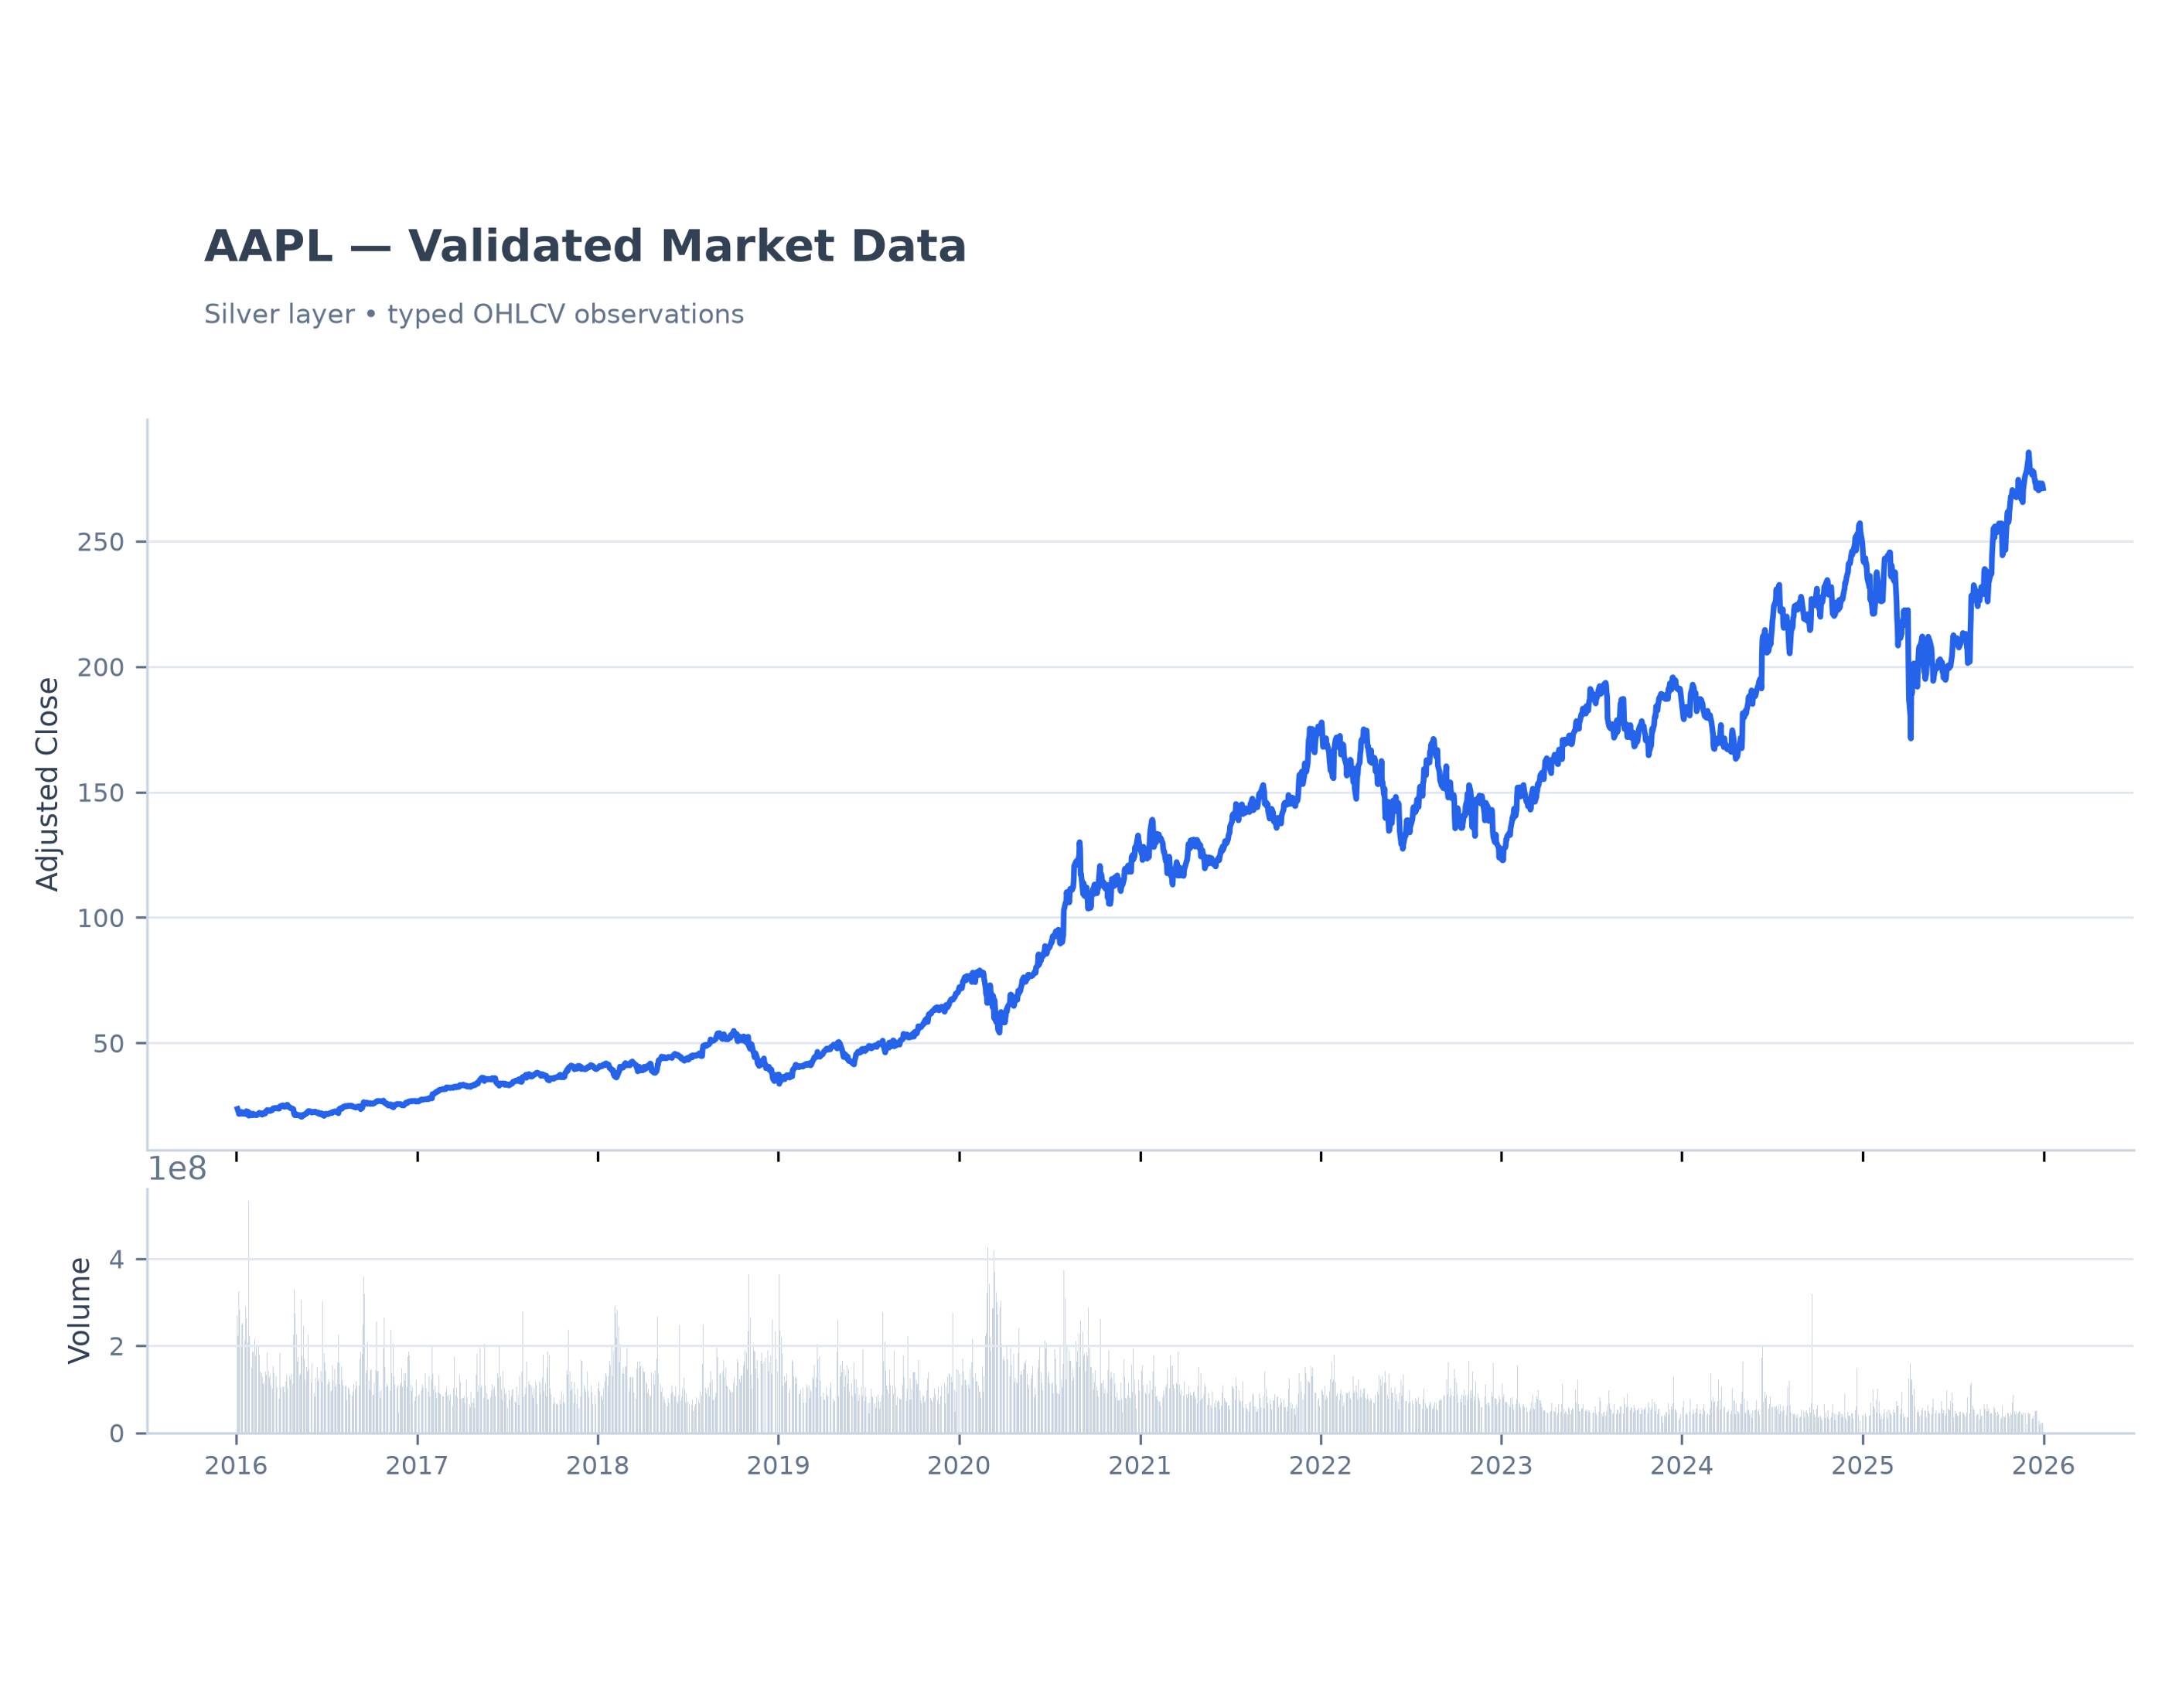
Validated market observations in the Silver layer, showing adjusted closing prices alongside trading volume for a representative security.
Downstream Dataset Construction
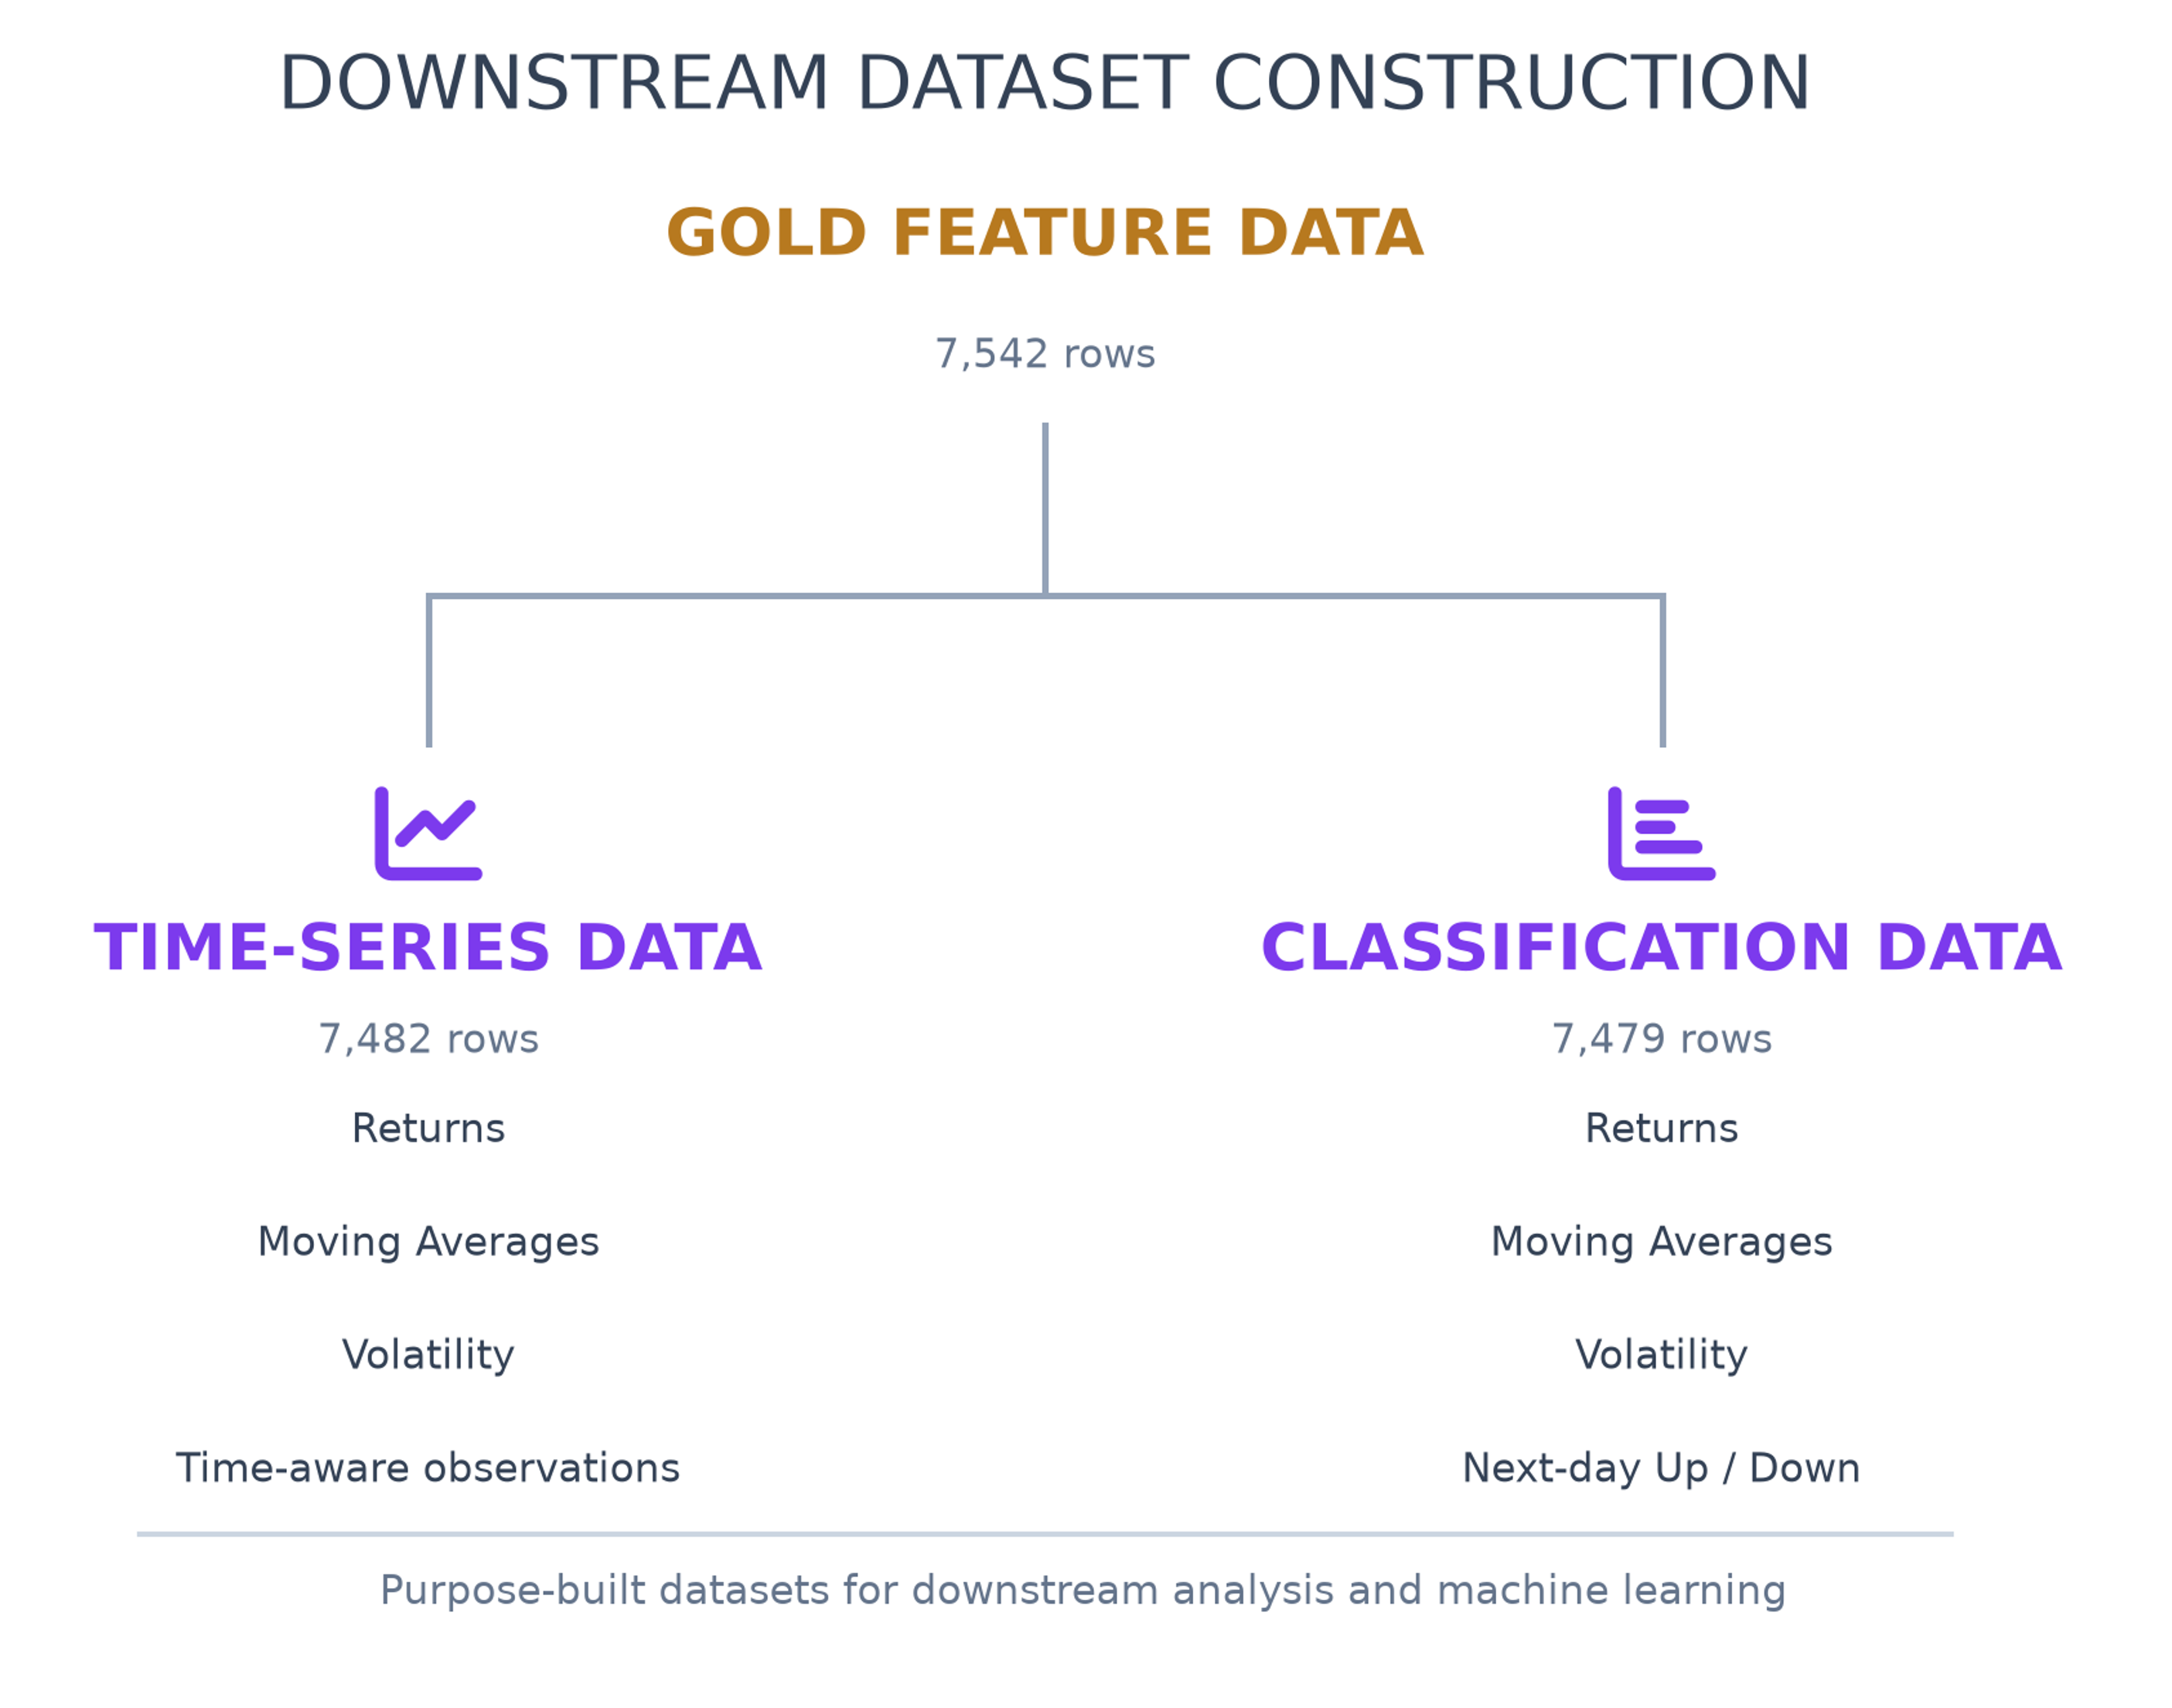
Two purpose-built downstream datasets derived from the shared Gold feature layer: a time-series dataset for temporal analysis and a classification dataset with next-day direction targets.
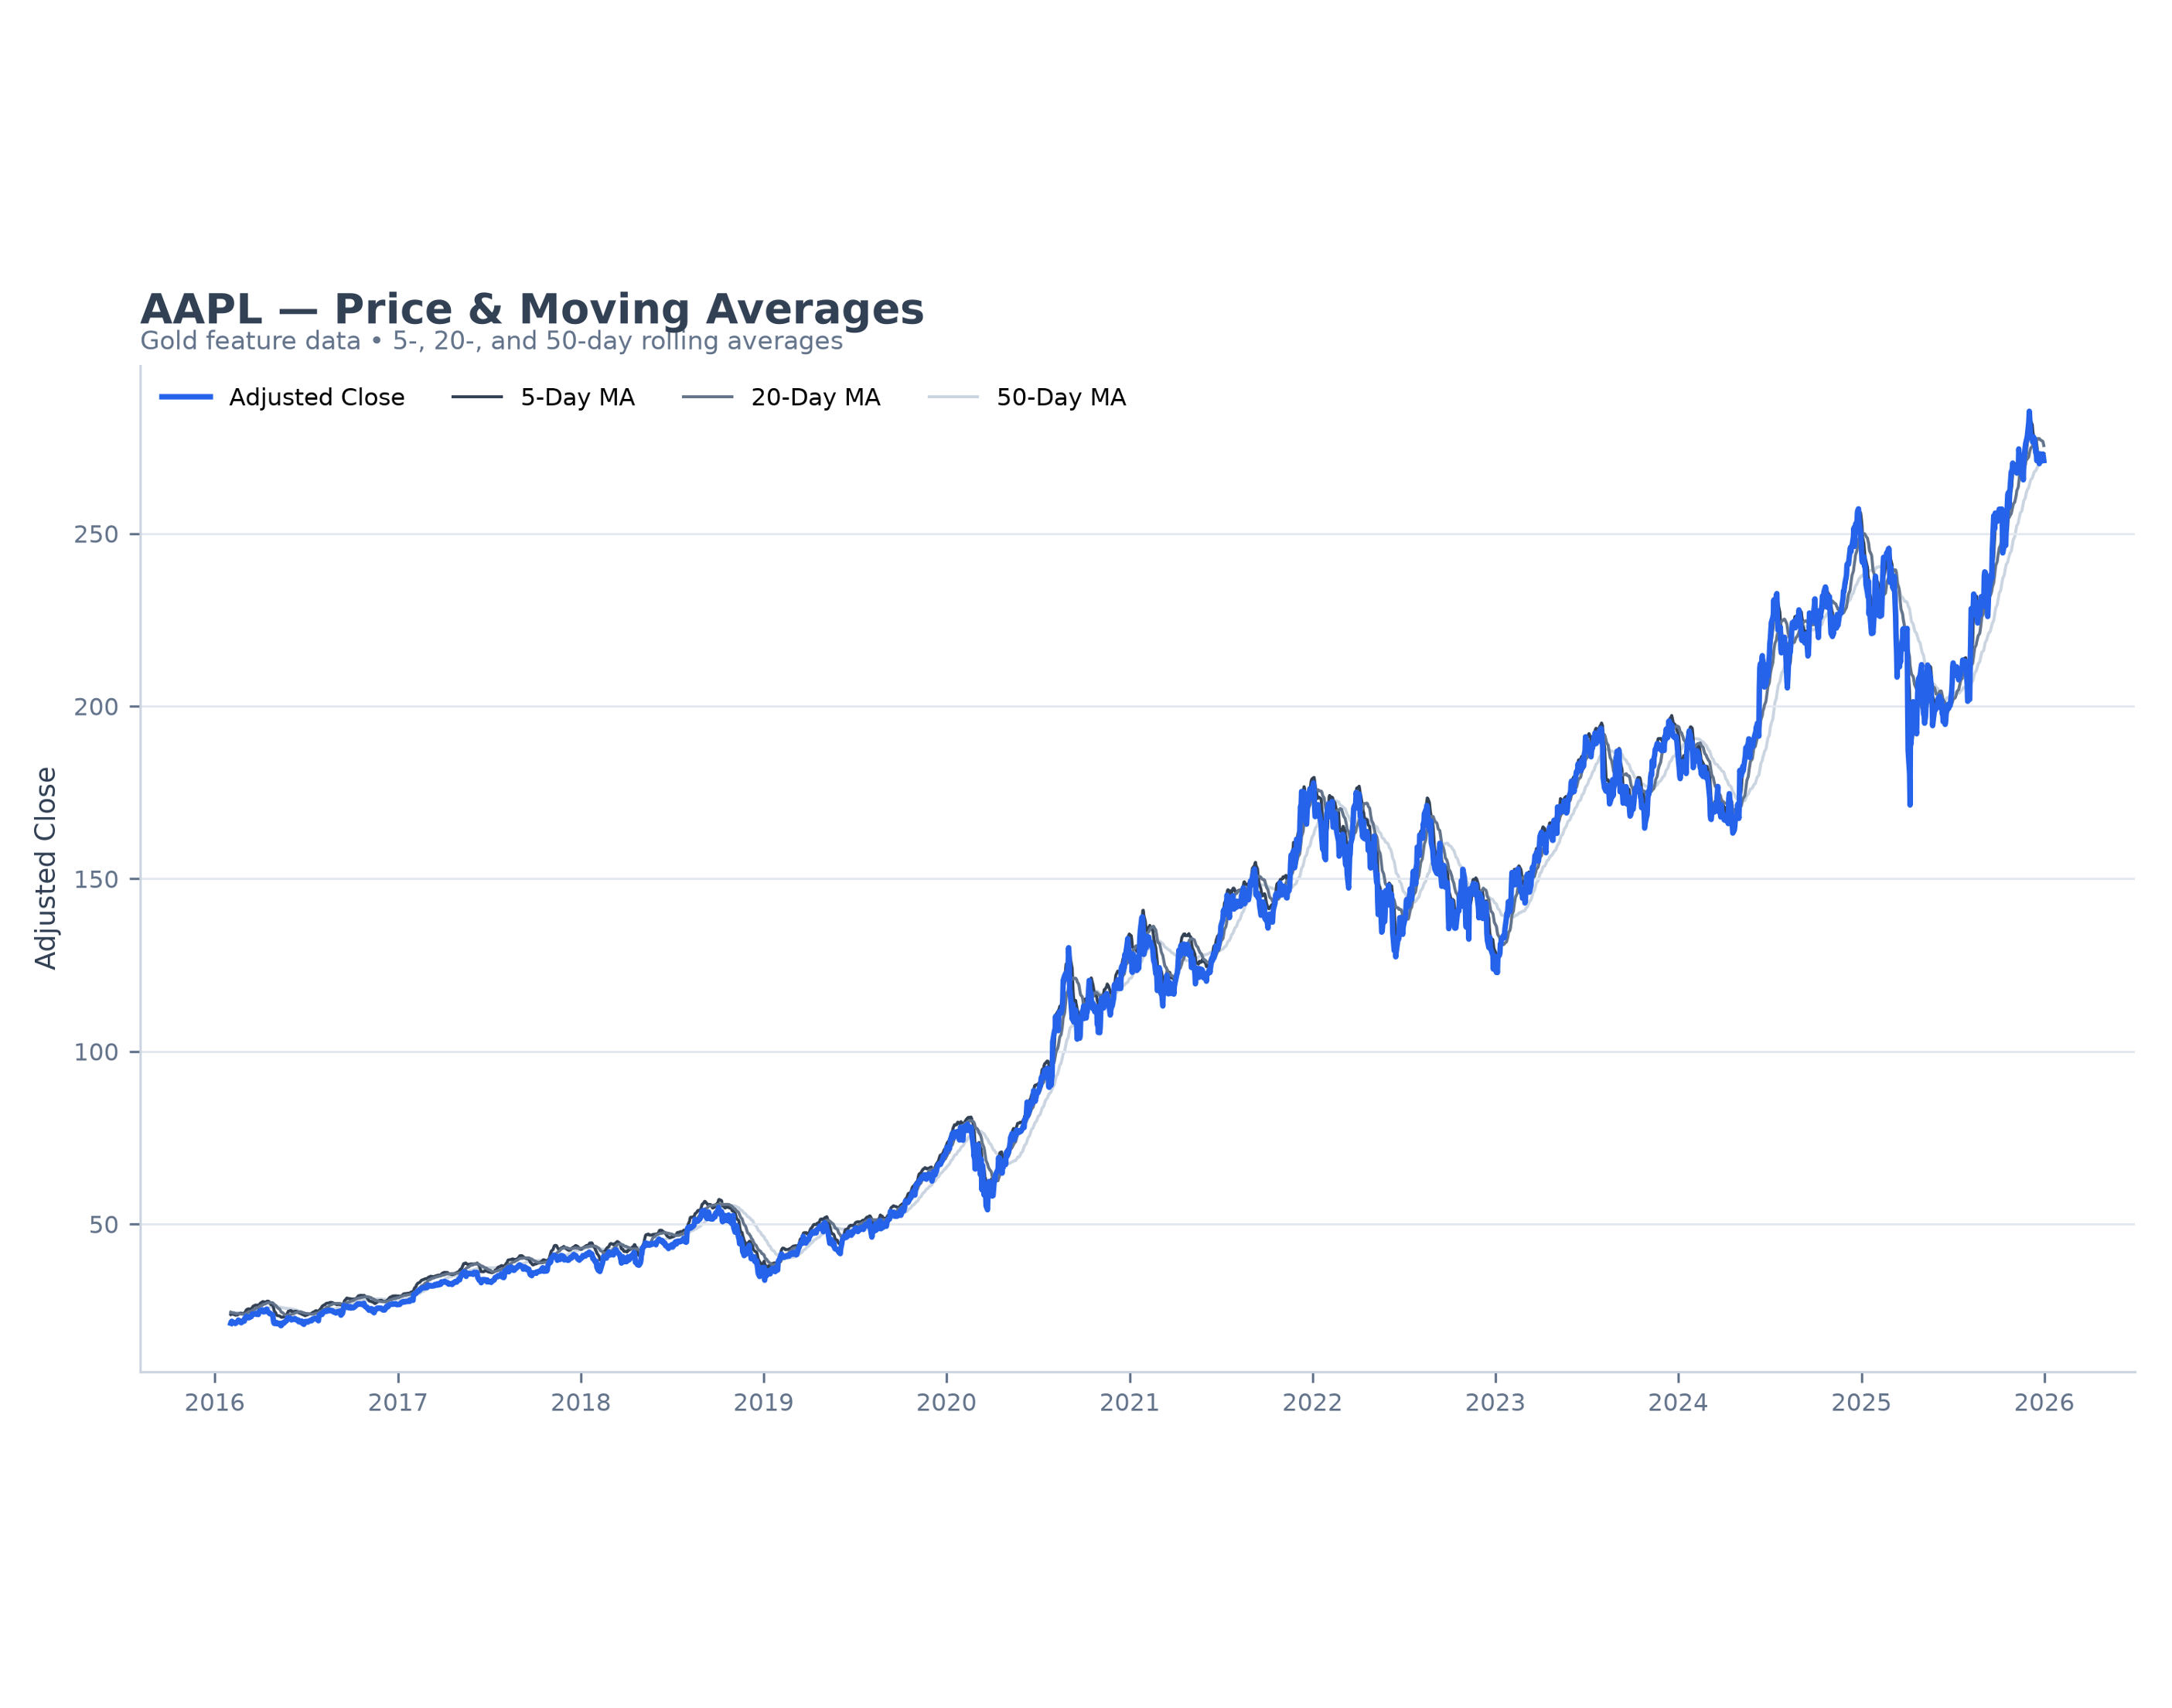
Time Series Features Market Data
Engineered time-series features applied to market data, illustrating adjusted closing prices alongside 5-, 20- and 50-day moving averages.
Lessons Learned
A reliable analytical workflow requires more than data ingestion; schema, quality, storage and transformation decisions are equally important.
A well-designed Gold layer can provide a reusable analytical foundation rather than coupling feature engineering to a single model or use case.
PySpark window functions provide an effective way to perform ticker-level time-series feature engineering while preserving the analytical structure of the data.
Separating pipeline implementation from notebook exploration improves reproducibility, maintainability and clarity.
Modular data architecture makes it easier to create new downstream datasets without rebuilding the upstream pipeline.
Future Improvements
Expand the pipeline to a larger universe of securities and additional market data sources.
Add incremental ingestion and partition-level updates instead of rebuilding the lakehouse for each run.
Introduce stronger fail-fast data quality gates and pipeline-level validation reporting.
Add additional financial features such as benchmark-relative returns, sector comparisons and longer-horizon risk measures.
Extend the downstream datasets to support additional analytical and machine learning use cases.